Energy-use related emissions
The use of a neighbourhood battery is not guaranteed to support decarbonisation efforts. The way the battery is operated will determine its contribution to carbon emissions. Recent work has highlighted the fact that if high carbon energy like coal or gas is used to charge the battery and low carbon energy like solar PV and wind is displaced as a consequence of the battery discharging, emissions can actually be increased.
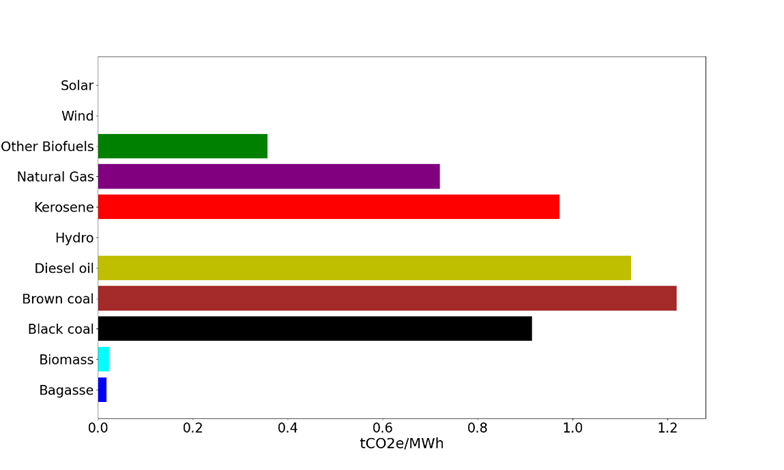
The graph below shows how the emissions intensity varies between different energy generators in the NEM, with brown coal and black coal having the highest emissions intensity (0.9-1.2 tCO2e/MWh) and renewables including hydro, wind and solar having the lowest emissions intensity (0 tCO2e/MWh). Modelling has found that the emissions intensity of charging or discharging to the grid in the NEM does not vary greatly throughout the year, but that it does vary significantly during the hours of the day, i.e. between overnight (9pm-5am), the morning peak (7-9am), midday (12-2pm) and the evening peak (5-9pm).
It is therefore important to consider carefully how the battery will be operated and for what objective. Often, the most economic operation of the battery does not coincide with the least environmental impact. Choosing how the battery will operate may require trade-offs between different values and goals. As demand across the day and types of generation will also vary region by region, it is important to note that one way of operating the battery may not apply the same everywhere. Being familiar with the energy use and characteristics of the neighbourhood is therefore an essential part of understanding what its emissions impact will be.
Some key points to note when considering the emissions intensity of the battery’s operation:
- when the energy market price is low, a battery wanting to reduce costs may be incentivised to charge from the grid. This may lead to the battery charging from fossil-fuel power plants. For example, overnight electricity used for charging a battery will likely have come from a coal-fired power plant. This means the battery is charging from high carbon energy with a high emissions intensity per MWh of generation
- same can go for times when the energy market price is high and the battery wants todischarge to the grid to maximise revenue. For example, the battery may discharge and displace generation from a hydro power plant with a zero emissions intensity.
Another important component to emissions intensity of a battery’s operation is the question of whether a neighbourhood battery is better at reducing emissions than residential batteries. The difference to note here is that residential batteries are behind-the-meter, meaning they are owned and operated primarily by the customer rather than the grid. Neighbourhood batteries on the other hand, are often located in-front-of-the-meter, meaning they can be operated to benefit the grid according to different cost, emission or network support objectives. Previous modelling showed how neighbourhood batteries allowed for a 660 mtCO2e reduction per MWh of installed energy storage compared to 355 mtCO2e per MWh of installed residential storage.
Emissions impact across NEM regions
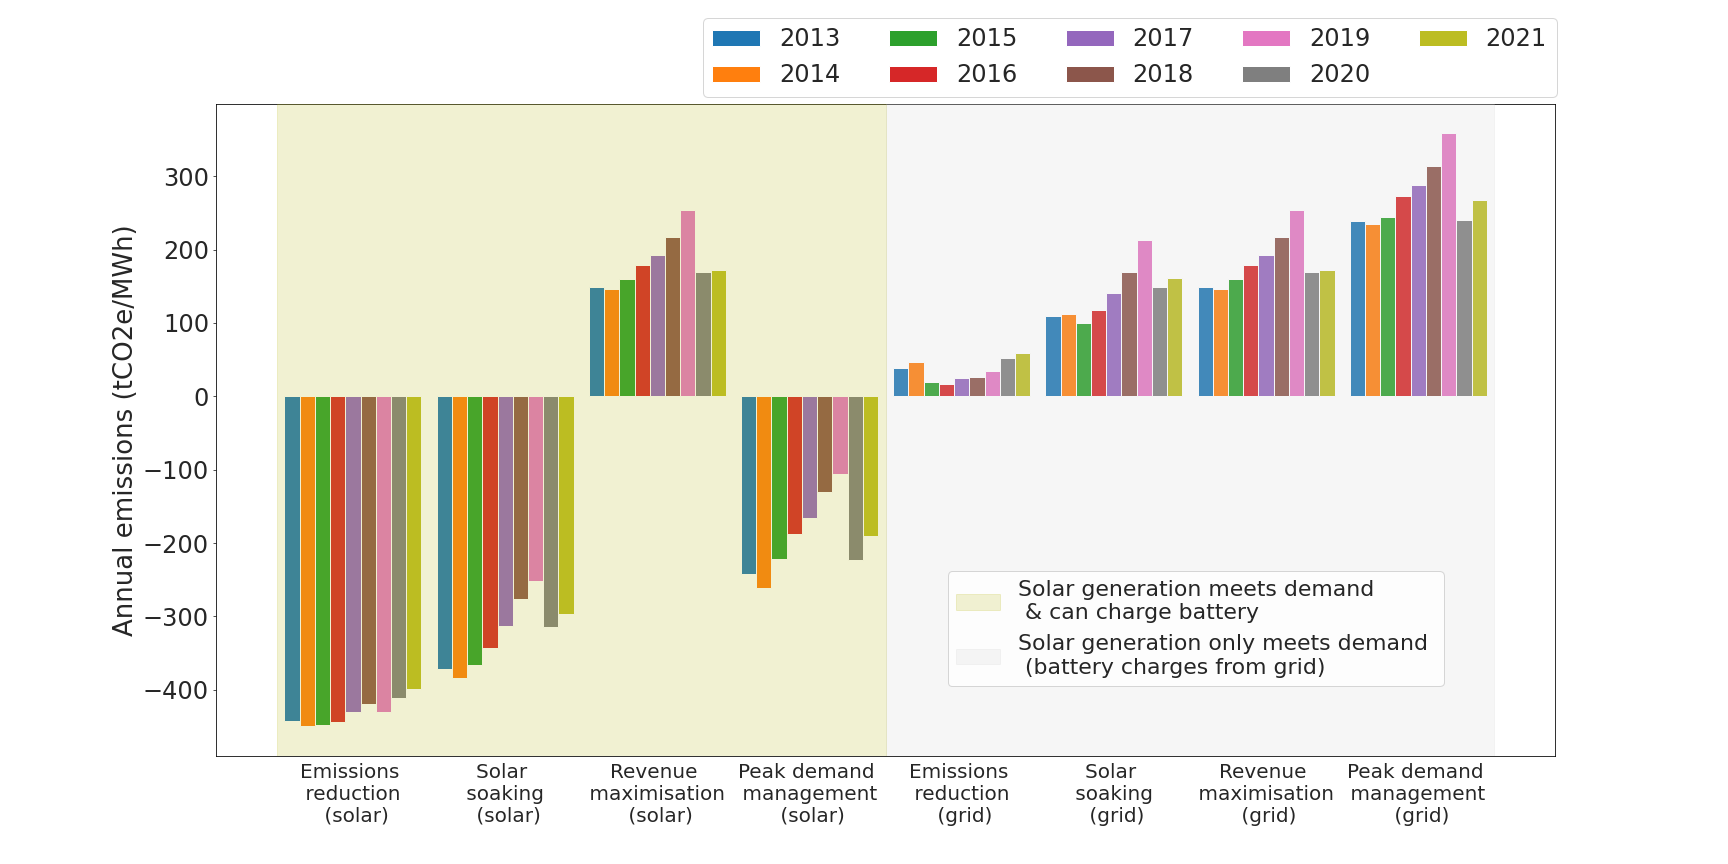
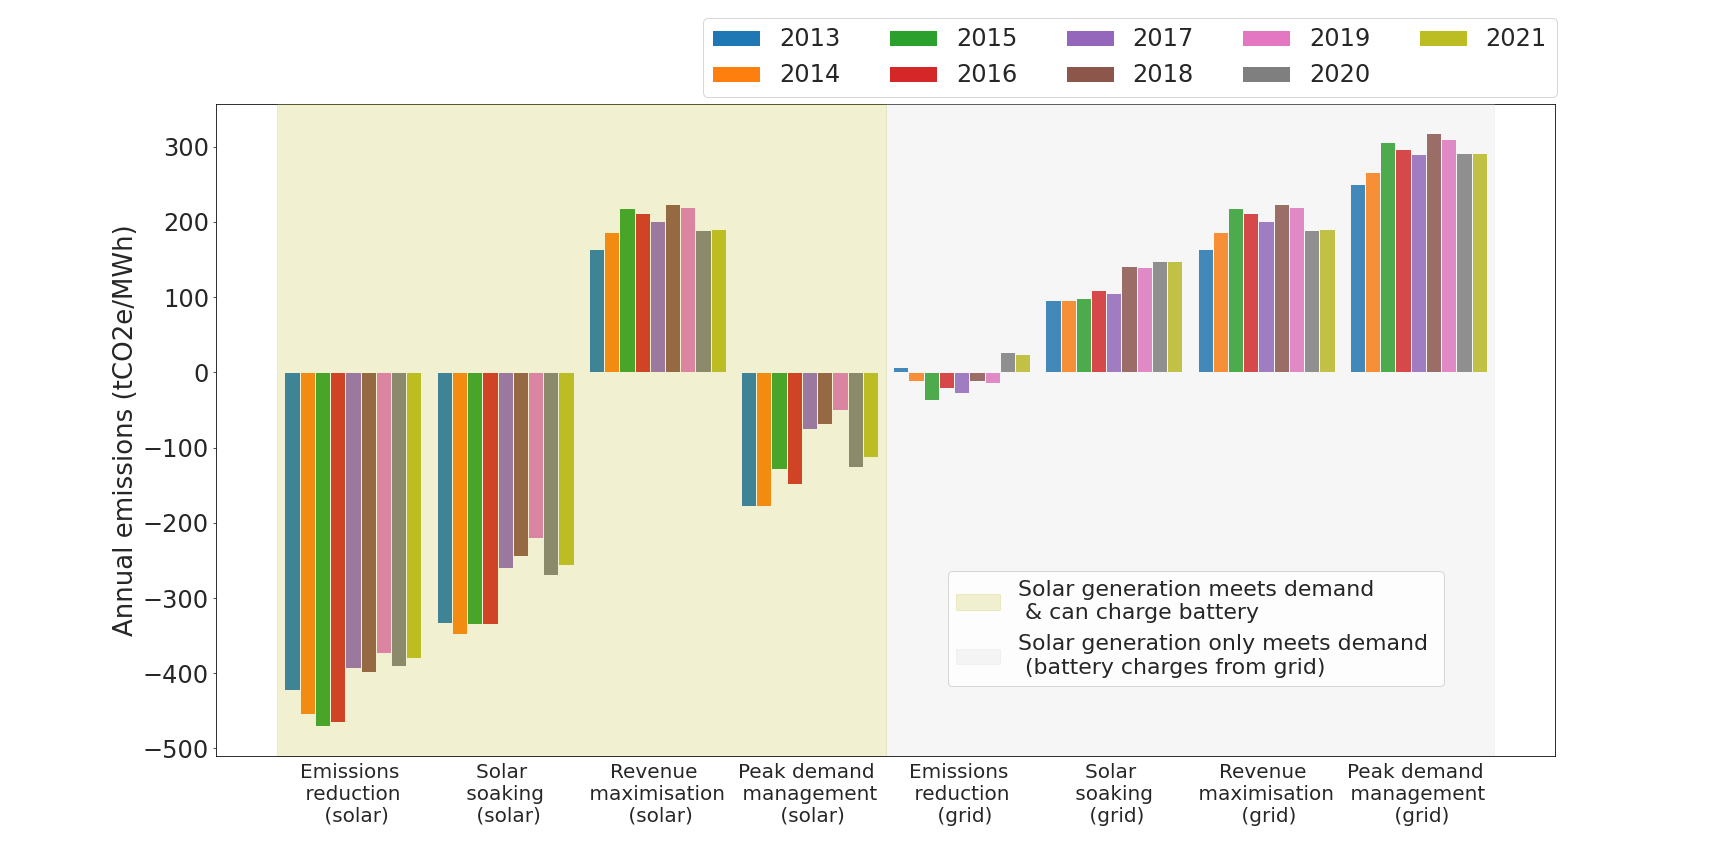
The following figures provide some more detailed modelling for the emissions impact of a neighbourhood battery had it been operating since 2013. As can be seen in the plots, the decarbonisation of the energy grid has meant the emissions reduction has lessened and the emissions increase has grown from 2013 to 2021. This is specifically because the emissions intensity during the evening peak has decreased over these years due to the growth of hydro and natural gas plants over more carbon intensive black and brown coal plants. You can also see how, in regions like NSW and QLD where there is still a lot of black coal generation, a battery not operated to only charge off excess solar could have an even greater impact on increasing emissions, rather than reducing them.
VIC
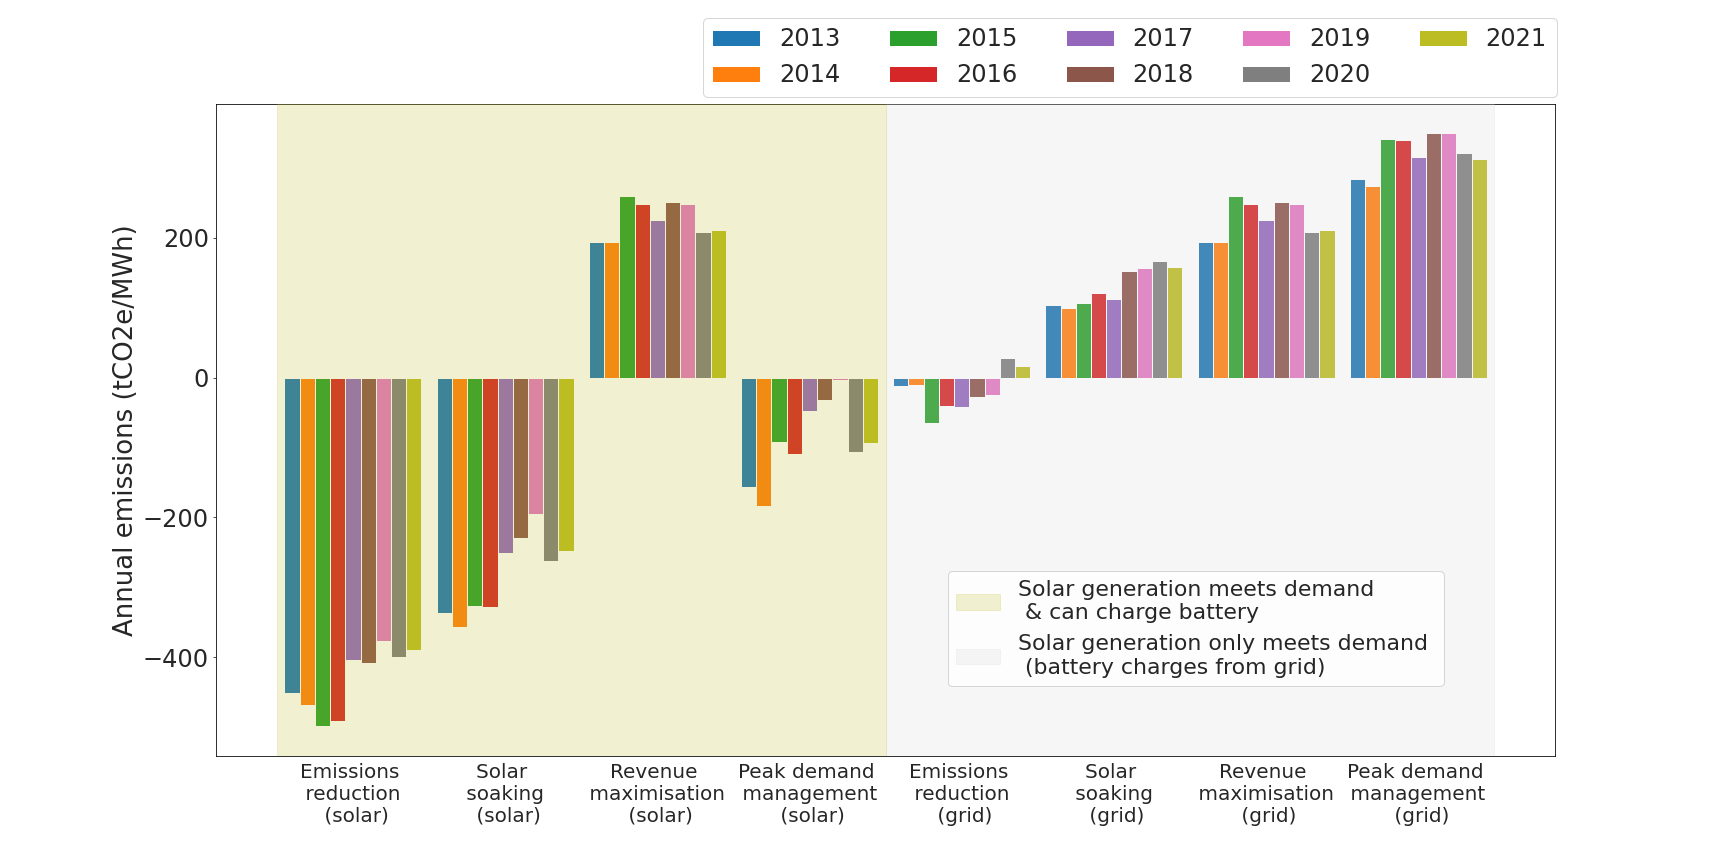
NSW
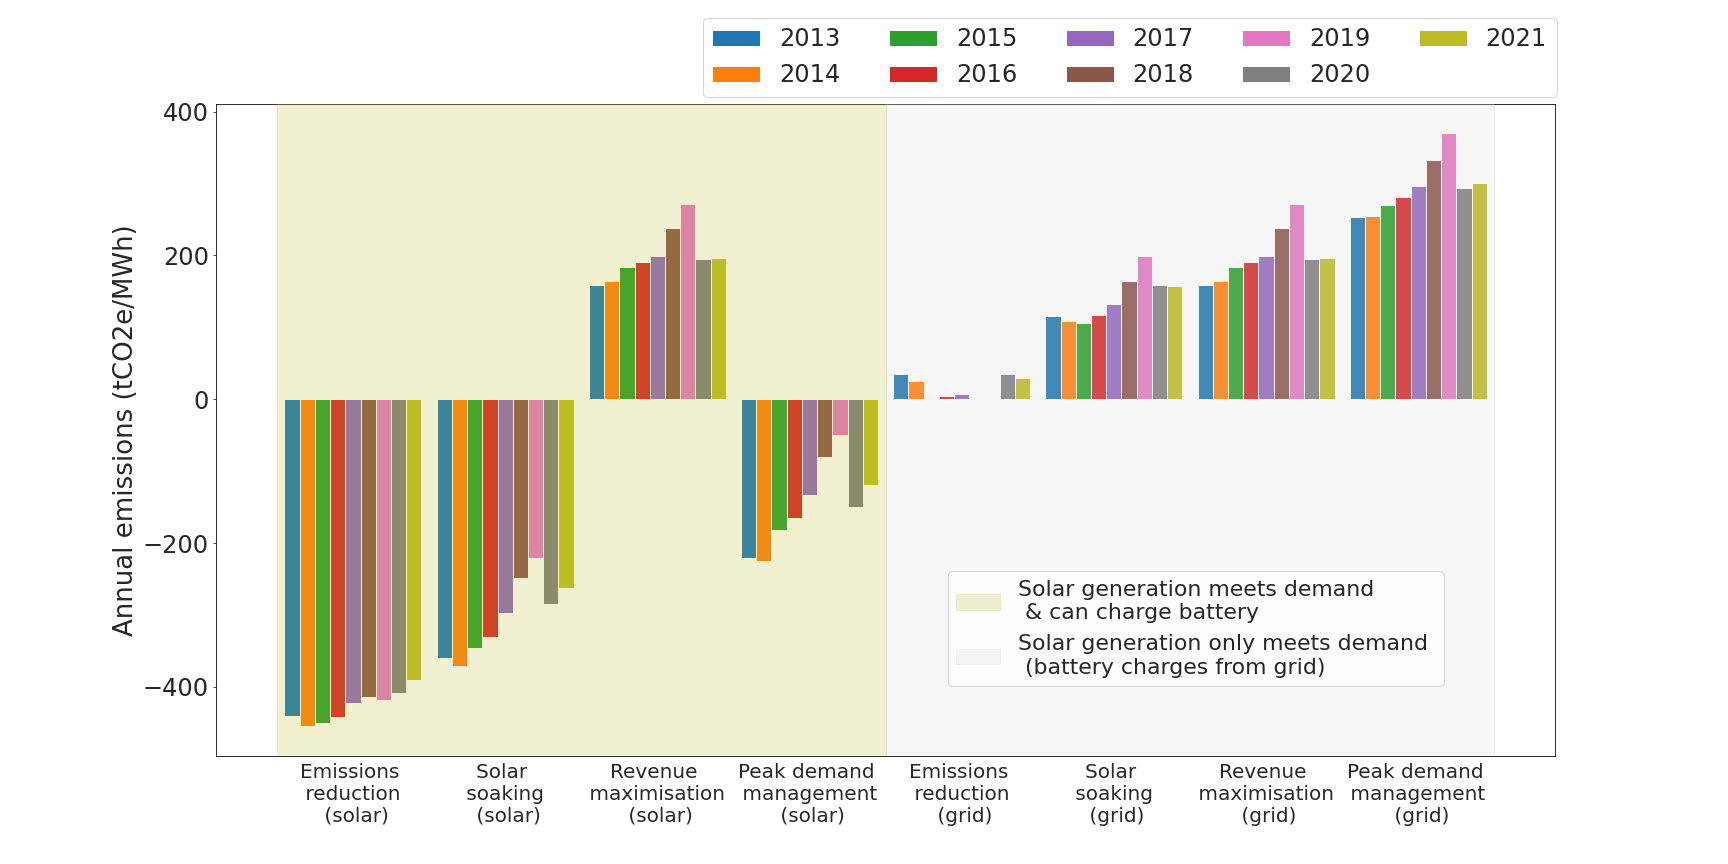
SA
QLD