
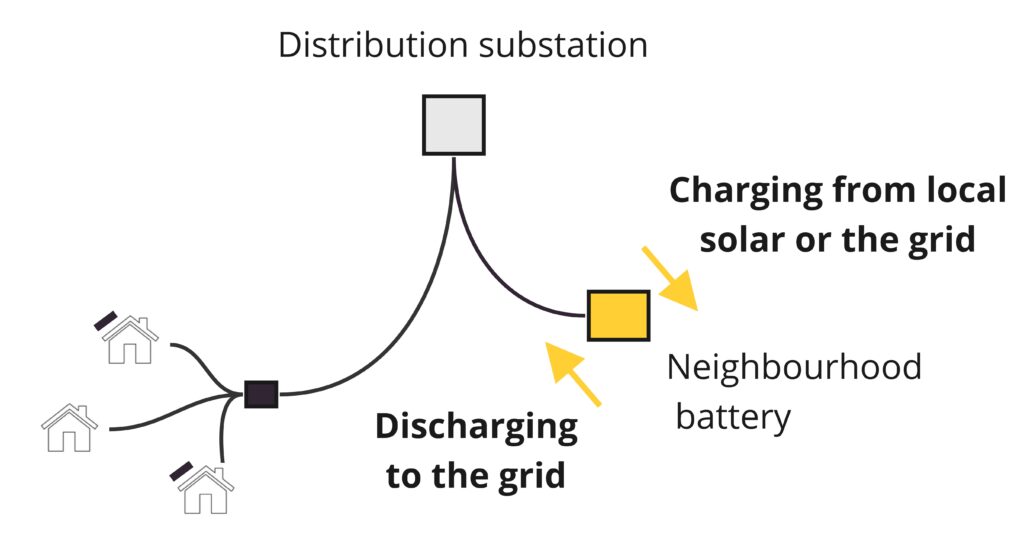
The main source of emissions associated with a neighbourhood are those associated with its operation. Most specifically, the emissions associated with the energy used to charge the battery. As shown below, energy used to charge the battery can either come from local solar generated by nearby rooftop solar (i.e. from homes on the same feeder/s below the distribution substation where the neighbourhood battery is connected) or from the grid. As such, emissions intensity for charging a neighbourhood battery depends on the time of day of which it charges. This will be set by the battery’s objectives and operation.
Curtailed solar vs. excess solar
Curtailed solar is solar energy that goes to ground. In other words, solar generation that exceeds the physical limits of the system (e.g. due to overvoltage) and therefore must be curtailed at the inverter. For example, during the middle of the day when solar irradiance is very high, solar energy generation from rooftop solar systems must be wasted in order to not overload/damage the network.
Excess solar is that exported from a household to the grid (via the household’s bi-directional utility meter required of all solar systems). For solar households, when this solar energy is sent to the grid across their bi-directional meter, they earn a credit on their energy bill known as the feed-in tariff (FiT).
When discussing emissions impact of a neighbourhood battery, we will be looking at both wasted and excess solar that is, or could be made, available for the neighbourhood battery to locally store and use at a later time (rather than being exported via the distribution transformer or curtailed). We will refer to this as excess solar. When looking at impacts on hosting capacity, we will be focusing on the potential of Curtailed solar, i.e. additional solar generation that can be added to the network without overloading the voltage or other ‘constraints.’
Solar soaking
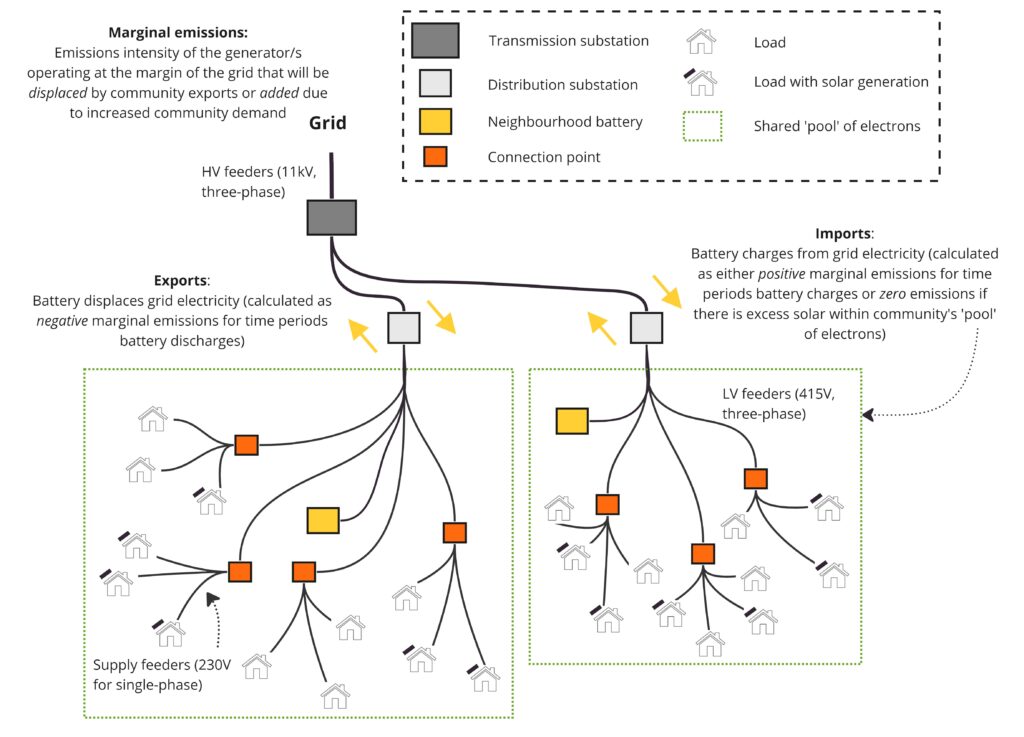
On a feeder, if there is excess solar from local solar generation (e.g. from a neighbour’s rooftop solar system), you can assume that those solar electrons will stay locally (electrons, like most people, like to take the path of least resistance). This means that, if there is demand at the same time that there is excess solar generation, it can be assumed that those solar electrons will be used to meet that demand.
This assumption is why, even though the neighbourhood battery will always be connected and operating outwardly with the grid, a battery charging midday on a part of a feeder with excess local solar generation can be assumed to be charging off zero emissions (solar) electricity.
Calculations
Calculations – light version
There are four main operating scenarios for how a battery could operate. These are:
- Emissions reduction: battery only charges during the solar hours and discharges when emissions are highest
- Solar soaking: battery only charges during the solar hours and discharges to reduce demand during the evening peak
- Revenue maximisation: battery operated to maximise energy arbitrage revenue, charging when prices are lowest and discharging when prices are highest
- Peak demand management: battery goes through two daily cycles to meet high demand during both the morning and evening peaks
| Scenario | Services | Charging Times | Discharging Times |
|---|---|---|---|
| Emissions reduction | Decarbonisation | 12-2pm | 2-4am |
| Solar soaking | Solar soaking | 12-2pm | 5-7pm |
| Revenue maximisation | Energy arbitrage | 2-4am | 5-7pm |
| Peak demand management | Solar soaking Energy arbitrage | 2-4am, 12-2pm | 7-9am, 5-7pm |
In the above scenarios, it is important to note that in the peak demand management scenario the battery’s lifetime will be halved as it involves two cycles per day instead of just one (which is typically the recommended number of cycles per day to maintain battery’s lifetime). For revenue maximisation, it has been assumed that energy prices are lower overnight rather than in the middle of the day. Depending on the location and time of year, however, prices may be lower during the middle of the day, meaning that the revenue maximisation scenario would have the same emissions impact as the solar soaking scenario.
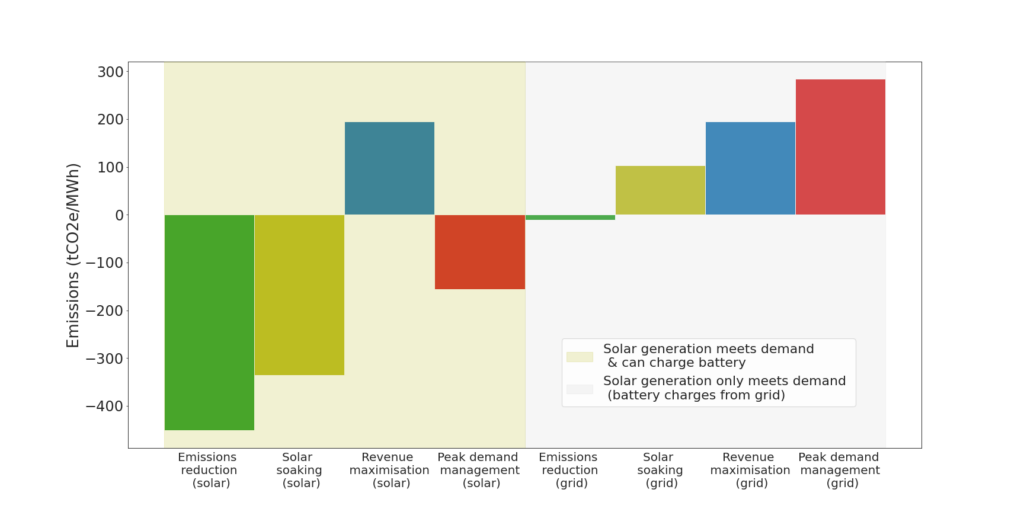
Between the above four scenarios, they will also depend on the amount of available local solar generation. If there is excess solar generation on top of that needed to meet demand, the battery when charging midday will be charging off solar (excess solar). If there isn’t excess solar generation, and only enough to meet demand, then the battery if charging midday during the solar sponge period will be charging off grid energy (no excess solar).
The below graph shows how the battery’s operation can either reduce or increase emissions, depending on its operating schedule. As illustrated, when there isn’t local solar generation, in all but emissions reduction, the neighbourhood battery will have an annual net positive impact on emissions. When there is solar, the battery will have an annual net negative impact on emissions.
The table below estimates the daily charging emissions, daily discharging emissions, and annual emissions impact for the eight different operating scenarios for a 1MWh battery. In calculations, it was assumed the battery had a 85% round-trip efficiency, 90% depth of discharge (DoD), and an average 90% degradation rate reduction was applied (assuming battery degrades to 80% of its useable capacity over a 10-year lifetime).
| Scenario | Daily Charging Emissions (tCO2e/ MWh of battery capacity) | Daily Discharging Emissions (tCO2e/ MWh of battery capacity) | Annual Emissions Impact (tCO2e/ MWh of battery capacity) |
|---|---|---|---|
| EXCESS SOLAR | |||
| Emissions reduction | 0 | 1.237 | -451 |
| Solar soaking | 0 | 0.921 | -336 |
| Revenue maximisation | 1.455 | 0.921 | +195 |
| Peak demand management | 1.455, 0 | 0.936, 0.921 | -146 |
| NO EXCESS SOLAR | |||
| Emissions reduction | 1.205 | 1.237 | -11 |
| Solar soaking | 1.205 | 0.921 | +104 |
| Revenue maximisation | 1.455 | 0.921 | +195 |
| Peak demand management | 1.455, 1.205 | 0.936, 0.921 | +294 |
Over the battery’s lifetime, the emissions impact associated with the different operating schedules will change with the increased penetration of renewables. Specifically, during the middle of the day, excess grid-scale solar and wind generation will keep driving down the energy market price. This has already begun to happen in the last couple years, meaning the revenue maximisation scenario and solar soaking scenario may have the same emissions impact. This however will not be the case for a battery not operated to only allow charging during the solar hours.
Calculations – full version
Data
- Emissions (average or marginal) timeseries data (5-min intervals)
- Battery timeseries charging/discharging (5-min intervals)
- Solar generation timeseries data (5-min intervals)
- Solar penetration in neighbourhood, increased local solar consumption due to the battery
- Number of cycles per day and number guaranteed by the manufacturer
- Substation import/export data, to assess whether the battery is reducing grid imports and exports
Software
- Python, Pandas
- Microsoft Excel